 PVsyst plays a vital role in modern solar plant design. It helps engineers analyse system performance, estimate energy yield, and improve project accuracy. Therefore, understanding how it works is essential for solar designers. This guide explains its features, design processes, reports, and practical value clearly and simply.
What is PVsyst?

It is a solar simulation software widely used in the renewable energy sector. Therefore, engineers use it to design solar power plants optimally and estimate energy yield. Additionally, it is a powerful tool that gives a quick analysis of the system and shows if any enhancements can be made.
Why PVsyst?
It performs several essential tasks, such as:
Precisely evaluates various PV module configurations and identifies the most efficient arrangement.
Also, provides an overview of the type and quantity of modules and inverters required.
The software supports cost estimation and profit calculation.
Lastly, projects long-term power generation, helping users assess project benefits.

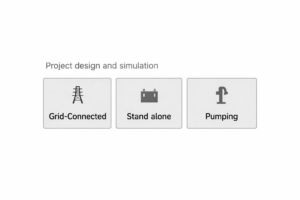
Pumping System
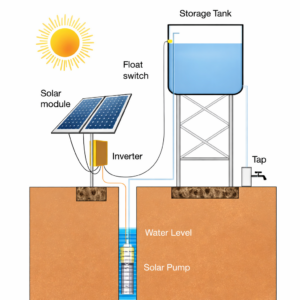 Designers start a solar pumping project by defining water demand and site conditions. They calculate flow rate, total head, and pipe losses to size the system correctly. Moreover, they analyse solar availability to predict daily output.The PV syst tool simulates hydraulic performance accurately. Therefore, designers optimise pump selection, energy use, and water delivery for efficient real-world operation.
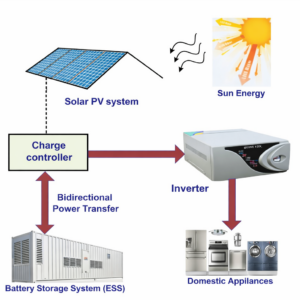
Standalone System
Designers plan a grid-connected system by analysing load patterns and utility requirements. They select module layout, size the inverter, and check export limits. In addition, they evaluate shading and system efficiency. The PV syst platform models performance with grid interaction clearly. Consequently, designers maximise energy production and ensure smooth, stable integration with the power network.
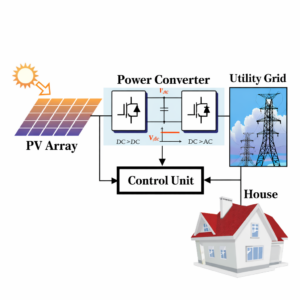
Grid Connected
Designers plan a grid-connected system by analysing load patterns and utility requirements. They select module layout, size the inverter, and check export limits. In addition, they evaluate shading and system efficiency. The pv syst platform models performance with grid interaction clearly. Consequently, designers maximise energy production and ensure smooth, stable integration with the power network.
PVsyst Options for System Design
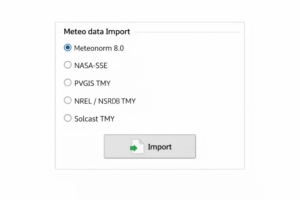
PVsyst gathers monthly meteorological (meteo) data, including irradiation data, from different sources such as Meteonorm, NASA, PVGIS, NREL, and Solcast after obtaining the location details.
Meteo Data Import Options in PVsyst
By giving the basic input details like location, plane orientation, near-shadings, type of inverter, PV module, and their mounting structure. Therefore, the system can analyze various simulation variables such as losses, specific generations, and performance ratios.
Input And Output Details in PVsyst 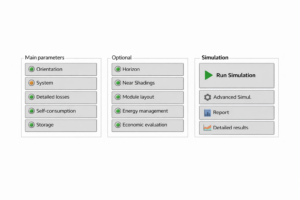
PVsyst requires key inputs such as project location, meteorological data, PV modules, inverters, system orientation, mounting structure, and shading conditions. Based on these parameters, the software performs detailed simulations to evaluate system performance. The outputs include annual energy generation, specific generation, performance ratio (PR), and detailed loss analysis.
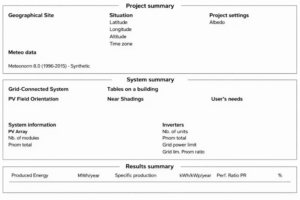
All About PVsyst Report
PVsyst generates a report containing a project summary, system summary, and result summary on the first page.
 Loss Diagram in PVsyst
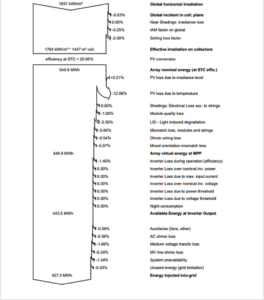
The PVsyst loss diagram illustrates how the available solar irradiation is progressively converted into usable electrical energy while accounting for system losses. Starting with 1837 kWh/m² of global horizontal irradiation, losses occur due to IAM effects (0.25%), soiling (2.0%), temperature losses (12.98%), module quality (1.0%), LID (2.5%), mismatch losses (0.6%), DC wiring losses (0.54%), inverter losses (1.4%), AC losses, transformer losses, and system unavailability (1.24%).
Key Results in The PVsyst Report

The main results include:
- Annual energy production (MWh/year)
- Specific production (kWh/kWp/year)
- Performance ratio
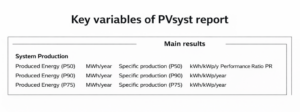
The report also contains P50-P90 evaluations, which use probability-based analysis to estimate annual energy generation. Hence, it helps the user to guarantee the amount of generation to a client. For example, P50 represents the value that the system will exceed 50% of the time.
Limitations And Practical Value
System parameters and near-shading conditions must be well aligned to minimize design mismatches. Although PVsyst has certain limitations, such as limited support for bifacial east-west orientation and detailed yearly generation data, these are relatively minor.
The advantages of PVsyst far outweigh these limitations.
Next Read: Understanding Meteorological Data in PV System Solar Design — learn how weather data shapes accurate solar performance predictions.