...

Detailed Losses in Pvsyst Explained: A Designer’s Guide (Part 5)

Detailed Losses in PVsyst Explained

As discussed in Part 1 of this series, PVsyst Software Guide for Solar Designers several factors contribute to energy losses in a PV system, which also affect the final energy output and overall system performance. So, understanding and accurately defining these PVsyst losses is essential for reliable energy yield analysis and efficient solar plant design.

Interestingly, in a solar power system, losses occur at multiple stages of generation and transmission. These losses can significantly impact the system’s efficiency if not evaluated properly during the simulation stage.

Some of the major types of PVsyst losses include:

            • Array losses
            • DC wiring losses
            • AC wiring losses
            • Losses in transformers and transmission lines
            • System losses

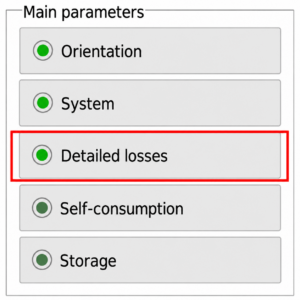
PVsyst enables engineers and designers to define and analyze these losses through the Detailed Losses section under the main parameters. As a result, users can perform more accurate simulations, optimize system performance, and improve overall energy generation predictions. Let’s discuss these in further detail.

1. ARRAY LOSSES

Array losses are a major component of PVsyst losses because they directly affect the available output energy of the PV array compared to the module’s nominal power rating under Standard Test Conditions (STC), as specified by the manufacturer. 

Secondly, these losses occur due to multiple environmental and operational factors that reduce the actual energy generated by the PV modules. Therefore, accurately defining array losses in PVsyst is essential for realistic energy yield simulations and performance evaluation. 

Typically, these losses include the following:  

1. Array Soiling Losses

Soiling losses occur when dust, dirt, or other particles accumulate on the glass surface of PV modules. In turn, this reduces the amount of sunlight reaching the solar cells. As a result, the system experiences a reduction in energy generation.

The impact of soiling largely depends on weather conditions and the surrounding environment. For example, sandy dust may blow away easily, whereas clay-based soil tends to stick to the module surface for longer durations.


 Similarly, sites located near highways, industrial zones, or cement plants usually experience higher soiling-related PVsyst losses. 

In PVsyst, the commonly assumed annual soiling losses are: 

          • 2% for manual or conventional cleaning systems  
          • 0.8% for robotic cleaning systems  
          • 3–4% for high-dust areas such as cement factory zones  

Additionally, PVsyst allows users to define month-wise soiling loss values for more accurate simulations. However, estimating monthly losses can be challenging because environmental conditions vary throughout the year. 

For instance: 

          • Rainfall may naturally clean the module surface  
          • Secondly, summer seasons may increase dust accumulation due to sandstorms  
          • Third, morning dew during colder months may cause dirt to stick more firmly to the glass surface  

Therefore, engineers should carefully assess site-specific conditions while defining soiling-related PVsyst losses to improve simulation accuracy and system performance predictions.


2. Thermal loss factor

Thermal losses are another important category of PVsyst losses because module performance decreases as the operating temperature rises. Since PV modules are rated under Standard Test Conditions (STC) at 25°C, any increase in module temperature beyond this point reduces the module’s efficiency and energy output. 

In actual operating conditions, PV cells heat up due to continuous solar irradiation, causing the cell temperature to become significantly higher than the ambient temperature. Therefore, PVsyst uses thermal loss factors to estimate the performance reduction caused by this temperature difference.

Typically, module manufacturers specify the Normal Operating Cell Temperature (NOCT), which represents the expected operating temperature of the module under standard outdoor conditions. In most cases, the NOCT value is considerably higher than the ambient temperature, making thermal losses a critical parameter in PV system simulations. 

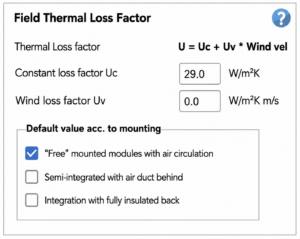
 Understanding Uc and Uv Thermal Loss Factors

The magnitude of thermally induced PVsyst losses also depends on the mounting structure and the airflow around the modules. Moreover, better air circulation helps dissipate heat more effectively, thereby reducing module temperature and improving performance. 

In PVsyst: 

          • Uc represents the constant thermal loss factor  
          • Also, it represents the wind-dependent thermal loss factor  

Although users can modify these values based on site-specific conditions, engineers generally avoid assuming excessive cooling effects from wind to maintain conservative and realistic simulations. 

PVsyst recommends default thermal loss values for different mounting structures: 

Free-Standing Systems

(ground-mounted systems with airflow around both sides of the modules)

Uc = 29 W/m²·K

Uv = 0 W/m²·K per m/s

Fully Insulated Back Systems

(flush-mounted installations above sheet metal roofs with minimal rear ventilation)

Uc = 15 W/m²·K

Uv = 0 W/m²·K per m/s

Semi-Integrated Systems

(installations on flat RCC roofs or tilted structures above sheet metal roofs)

Uc = 20 W/m²·K

Uv = 0 W/m²·K per m/s

Therefore, selecting the correct thermal parameters in PVsyst is essential for accurate performance modeling and reliable energy yield estimation, especially in regions with high ambient temperatures.

3.   Light-Induced Degradation (LID) 

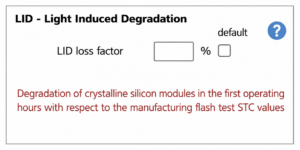
Light-Induced Degradation (LID) is one of the initial PVsyst losses that occurs during the first few days of a PV module’s exposure to sunlight. During this period, the module experiences a temporary reduction in performance before stabilizing at its normal operating efficiency.

The extent of LID mainly depends on the module technology and manufacturing process. Therefore, module manufacturers usually specify the expected LID values in the technical datasheet. 

In PVsyst, engineers must account for LID losses to achieve more accurate long-term energy yield predictions and realistic system performance assessments. 

Typically, the assumed LID values are: 

            • 2–2.5% for Polycrystalline, Monocrystalline, and Bifacial modules  
            • ≤ 0.5% for Thin Film modules  

However, the actual LID value may vary depending on the module type, cell technology, and manufacturer specifications. Therefore, it is always recommended to use manufacturer-provided data while defining LID-related PVsyst losses.

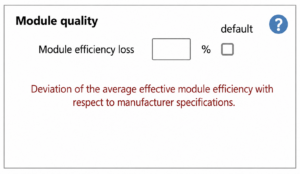
4. Module Quality Loss

Module Quality Loss refers to the variation between the actual average module efficiency and the efficiency specified by the manufacturer under standard testing conditions. Since manufacturing tolerances can cause slight differences in module performance, this parameter becomes an important part of overall PVsyst losses.

Furthermore, the extent of module quality loss largely depends on the manufacturing quality, product consistency, and quality control processes followed by the manufacturer. Therefore, modules with stricter quality assurance standards generally exhibit lower performance deviations and improved field reliability.

In addition, quality checks performed during module acceptance, testing, and on-site installation also influence the final module quality loss value used in PVsyst simulations.

Typically, module quality losses range between 0.5% and 1%, depending on the module manufacturer and technology. Additionally, lower module quality losses are always preferred because they contribute to better system performance and more accurate energy yield predictions.

Therefore, while defining module quality-related PVsyst losses, engineers should consider manufacturer specifications, factory testing reports, and field acceptance results to ensure realistic simulation outcomes. 

5. Module Misatmatch Losses

Module mismatch losses occur due to slight variations in the electrical characteristics of individual PV modules within a string. Since no two modules are perfectly identical, differences in current, voltage, or power output can affect the overall performance of the system.

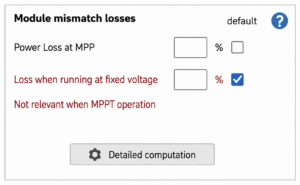
In a PV string, the output is typically limited by the weakest-performing module, particularly the module with the lowest short-circuit current (Isc). As a result, the entire string operates below its optimal performance level, leading to module mismatch-related PVsyst losses. 

Normally, these losses may arise due to: 

                • Manufacturing tolerances  
                • Variations in module aging  
                • Uneven soiling conditions  
                • Temperature differences between modules  
                • Differences in module orientation or degradation  

Although mismatch losses are generally unavoidable, proper module sorting, quality control, and optimized string design can help minimize their impact. 

Therefore, accurately defining module mismatch losses in PVsyst is important for improving simulation accuracy and achieving realistic energy yield estimations for PV systems. 

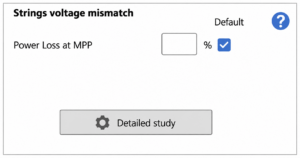
6. String Mismatch Losses

String mismatch losses occur due to variations in the electrical characteristics of different strings connected within the PV system. Unlike module mismatch losses, which occur at the module level, string mismatch losses mainly arise because of differences in string voltage when multiple strings operate in parallel.

Since parallel-connected strings must operate at a common voltage level, strings with lower electrical performance can limit the overall system efficiency. As a result, these variations contribute to additional PVsyst losses and reduce the total energy output of the plant.

Also, string mismatch losses can occur due to several factors, including:

          • Unequal string lengths
          • Variations in module performance
          • Different operating temperatures
          • Uneven shading or soiling conditions
          • Installation inconsistencies

In industry practice, module mismatch and string mismatch losses are often considered together during PVsyst simulations.

Typically:

          • 0.6% loss is assumed for systems using string inverters
          • 1.1% loss is assumed for systems using central inverters

Therefore, proper string sizing, balanced system design, and consistent installation practices are essential to minimize mismatch-related PVsyst losses and improve overall system performance.

7. IAM Loss Factor

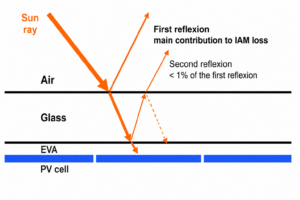
The Incidence Angle Modifier (IAM) loss factor represents the reduction in irradiance reaching the PV cell surface when sunlight strikes the module at an angle other than normal incidence. Moreover, this effect is an important component of PVsyst losses because it directly influences the amount of solar energy absorbed by the PV modules.

As the angle of incidence increases, a larger portion of sunlight gets reflected from the glass surface of the module instead of entering the solar cells. Consequently, the effective irradiance received by the cells decreases, leading to reduced energy generation.

In simple terms, PV modules perform most efficiently when sunlight falls perpendicular to the module surface. However, during early morning, late evening, or seasonal sun-angle variations, the incidence angle increases, thereby increasing reflection losses.

IAM-related PVsyst losses mainly depend on:

          • Module glass properties
          • Surface coating and anti-reflective treatment
          • Module tilt angle
          • Solar position and sun path

Therefore, accurately defining the IAM loss factor in PVsyst helps improve the precision of irradiance modeling and overall energy yield simulations.

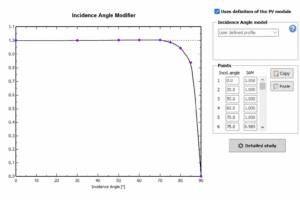
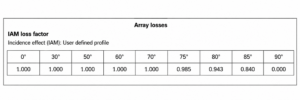
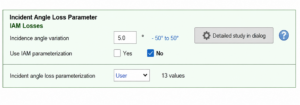
For clarity, IAM losses are shown below for user-defined profiles and are provided by the module manufacturer. 


Wiring losses

1. DC Wiring losses:

DC wiring losses are mainly caused by the ohmic resistance of the cabling and interconnections of the PV devices and strings. So, these can be estimated by summing the series resistances of each component and a simple circuit analysis of the voltage drop incurred due to the current flowing through those resistors.

DC wiring losses are one of the key electrical PVsyst losses and mainly occur due to the ohmic resistance of cables and electrical interconnections within the PV system.  Normally, these losses arise when current flows through conductors, resulting in voltage drops and power dissipation across the DC network. 

In PV systems, DC wiring losses can be estimated by calculating the total series resistance of cables, connectors, and interconnections, followed by analyzing the voltage drop caused by the current flowing through these components. 
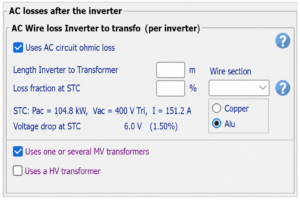
Several factors influence DC wiring-related PVsyst losses, including: 

        • Cable length  
        • Cable cross-sectional area  
        • Current carrying capacity  
        • String configuration  
        • System architecture  

Therefore, optimizing cable sizing and minimizing unnecessary cable lengths are essential for reducing DC losses and improving overall system efficiency. 

Based on industry practices and practical project experience, the commonly accepted DC wiring losses are: 

        • ≤ 1.5% for rooftop solar systems  
        • ≤ 2% for ground-mounted systems using string inverters  
        • ≤ 0.8% for ground-mounted systems using central inverters  

(Reference: Loss calculations based on a 1 MW rooftop plant and a 10 MW ground-mounted single-cluster plant. 

Accurately defining DC wiring losses in PVsyst helps engineers achieve more realistic energy yield predictions and optimise the electrical design of the solar power plant. 

As per industrial practice and from our experience, the average DC wiring losses are considered to be less than or equal to 1.5% in the case of roof-top. On the other hand, for ground mount systems it is considered to be less than or equal to 2% with a string inverter and is less than or equal to 0.8% with the central inverter. (Losses Calculation Reference: Rooftop 1 MW plant, Ground Mount 10MW single cluster) 

2. AC Wiring Losses

AC wiring losses are another important category of electrical PVsyst losses and occur due to the impedance present between the inverter output and the power injection point, including the medium-voltage (MV) transformer wherever applicable.

Similar to DC losses, AC wiring losses result from the resistance and impedance of conductors carrying alternating current. Ultimately, these losses lead to voltage drops and reduced power delivery efficiency within the AC network of the PV system.

In addition to this, PVsyst software automatically calculates the minimum required cable size based on the system configuration and electrical parameters. Additionally, users can select larger cable sections to further reduce AC wiring-related PVsyst losses and improve system efficiency.

Alternatively, PVsyst also allows users to define a target loss fraction at STC or nominal power (Pnom).

Based on the selected cable section, the software then calculates:

        • Corresponding cable length
        • Voltage drop at reference power
        • Associated AC wiring losses

Technically, several factors influence AC wiring losses, including:

        • Cable length
        • Cable impedance
        • Power transmission distance
        • Inverter configuration
        • System voltage level

Therefore, optimizing cable sizing and system layout plays a critical role in minimizing AC-side losses and improving overall plant performance.

Based on industry standards and practical project experience, the commonly accepted AC wiring losses are:

≤ 1.5% for rooftop solar systems

≤ 2% for ground-mounted systems using string inverters

≤ 0.8% for ground-mounted systems using central inverters

(Reference: Loss calculations based on a 1 MW rooftop plant and a 10 MW ground-mounted single-cluster plant.)

Furthermore, accurate modeling of AC wiring-related PVsyst losses helps engineers improve energy yield estimation and optimize the electrical design of solar power plants.

AC Losses in Transmission Line and Transformer 

AC losses in transmission lines and transformers are an important part of overall PVsyst losses because they directly affect the amount of energy delivered from the inverter output to the grid injection point. 

These losses occur due to the electrical resistance and impedance of transformers, overhead transmission lines, and underground cables used in the power evacuation system. Therefore, accurately defining these parameters in PVsyst is essential for realistic energy yield estimation and grid integration studies. 

In PVsyst, users can define one or multiple MV/HV external transformers, including: 

          • Inverter Duty Transformers (IDT)  
          • Power Transformers  

After defining the transformer configuration, users must specify the transmission system parameters based on the plant’s power evacuation scheme. This includes: 

          • Transmission type (overhead line or underground cable)  
          • MV/HV line voltage  
          • Conductor or cable cross-section  
          • Current carrying capacity  
          • Transmission line or cable length  

For example, in a system with a single MV transformer, if the MV line voltage is 20 kV and the transmission line length is 1 meter, the loss fraction at STC is typically considered around 0.5%. 

Transformer-related PVsyst losses mainly consist of: 

          • Iron losses (No-load losses)  
          • Copper losses (Resistive losses)  

The standard MV transformer losses generally considered in industry practice are: 

Aluminium Winding Transformer 

          • Total Loss: 1.1%  
          • 0.1% Iron loss / No-load loss  
          • 1.0% Copper loss / Resistive loss  

Copper Winding Transformer 

          • Total Loss: 0.9%  
          • 0.1% Iron loss / No-load loss  
          • 0.8% Copper loss / Resistive loss  

Since transformer and transmission losses directly influence the net energy exported to the grid, engineers should carefully define these parameters in PVsyst to improve simulation accuracy and optimize plant performance.

HV Transformer Losses in PVsyst

HV transformers are typically defined in PVsyst for voltage levels above 100 kV. These transformers play a critical role in transmitting power over long distances while supporting efficient grid integration for utility-scale solar projects. 

In general, standard HV transformer-related PVsyst losses are considered to be approximately 0.5%. Since these losses directly impact the net power delivered to the grid, accurately defining HV transformer parameters is essential for realistic energy yield simulations and transmission loss calculations. 

The figure below illustrates the required HV external transformer parameters in PVsyst.

System Losses

1. System Unavalability Losses

This refers to the energy losses that occur when the PV system remains non-operational due to planned maintenance activities or unforeseen shutdowns. Furthermore, these interruptions are an important category of PVsyst losses because they directly reduce the total operating time and energy generation of the plant. 

In PVsyst, users can define system unavailability either as: 

          • A fraction of total operating time  
          • A specific number of downtime days or hours  

During these defined periods, the software considers the system inactive (OFF) in the simulation, thereby reducing the final energy output accordingly. 

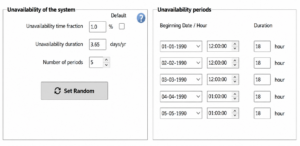
Additionlly, System unavailability may occur due to several reasons, including: 

          • Preventive or corrective maintenance  
          • Grid outages  
          • Equipment failures  
          • Communication or monitoring issues  
          • Unexpected operational shutdowns  

Generally, industry practice, system unavailability-related PVsyst losses are typically considered to be around 1.0% for standard PV systems. 

Therefore, accurately accounting for system downtime in PVsyst helps improve the reliability of energy yield assessments and provides a more realistic representation of actual plant performance.
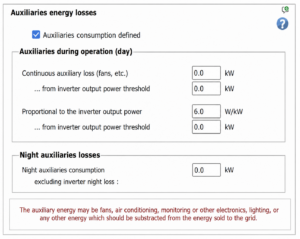
2. Auxiliary Losses

Auxiliary losses refer to the energy consumed by supporting equipment required for the operation and management of the PV system. Since this energy is consumed internally within the plant, it must be deducted from the total PV-generated energy before calculating the net energy exported to the grid. 

These operational losses form an important part of overall PVsyst losses because they directly affect the plant’s net deliverable energy. 

Typically, auxiliary consumption includes power used by: 

            • Cooling fans  
            • Air conditioning systems  
            • Monitoring and communication devices  
            • Control systems  
            • Plant lighting  
            • Other auxiliary electrical equipment  

The magnitude of auxiliary-related PVsyst losses mainly depends on the equipment installed within the solar plant and the overall system design. 

Also, in general industry practice, auxiliary consumption is considered: 

≤ 0.6% of the generated energy, or  
Approximately 6.0 W/kW proportional to the inverter output power  

Therefore, accurately defining auxiliary losses in PVsyst helps engineers estimate the net exportable energy more precisely and improve the accuracy of plant performance simulations. 

Conclusion

Understanding and accurately defining PVsyst losses is essential for realistic energy yield estimation and efficient PV system design. Since losses occur at multiple stages of power generation and transmission, even small deviations can significantly impact the overall performance of a solar power plant.

Hence, PVsyst summarizes these losses through a detailed loss diagram, which helps engineers analyze the contribution of each loss component within the system. As a result, designers can easily identify inefficiencies, optimize cable sizing, improve component selection, and refine the overall system configuration.

Therefore, a detailed loss analysis not only improves simulation accuracy but also supports better engineering decisions, enhanced system reliability, and improved long-term energy performance. Discover more insights in our comprehensive PVsyst series. Connect with us on LinkedIn to stay updated on our latest articles and industry news. Click here to read our latest posts.

Explore Our Project Portfolio

PVsyst probability distribution graph showing energy generation estimates and performance confidence analysis for a solar power project

FAQs

1. What are module mismatch losses?
Module mismatch losses occur due to variations in the electrical characteristics of individual solar modules within a string. These differences can reduce the overall performance of the PV system.

2. How do transformer losses impact energy generation?
Transformer losses occur due to iron losses and copper losses within the transformer. These losses reduce the amount of energy ultimately delivered to the grid.

3. What is system unavailability loss in PVsyst?
System unavailability losses represent energy losses caused by planned maintenance, equipment failures, grid outages, or other events that temporarily prevent the solar plant from generating power.

4. How does detailed loss analysis improve solar plant performance?
Detailed loss analysis helps engineers identify performance bottlenecks, optimize system design, improve energy yield predictions, and enhance the long-term reliability and efficiency of solar power plants.

5. How does InSolare use PVsyst detailed loss analysis to optimize solar plant performance?
At InSolare, PVsyst detailed loss analysis is an integral part of the engineering and design process. By evaluating factors such as soiling, temperature losses, mismatch losses, wiring losses, and system availability, our team identifies optimization opportunities early in the project lifecycle. This data-driven approach helps maximize energy yield, improve project bankability, and deliver high-performance solar solutions across utility-scale, commercial, and industrial applications.

Leave a Comment

Your email address will not be published. Required fields are marked *

17 + eighteen =

Scroll to Top
Seraphinite AcceleratorOptimized by Seraphinite Accelerator
Turns on site high speed to be attractive for people and search engines.