PV System Meteorological Data: A Designer's Guide (Part-2)
Understanding PV System Meteorological Data
Previously, we explained PVsyst software, simulations, and reports, and how PVsyst plays a vital role in modern solar plant design. It enables engineers to analyze performance, estimate energy yield, and improve overall project accuracy. Therefore, understanding its core inputs is essential for precise PV system solar planning.
Now, we move to the foundation of every PV system solar design — meteorological data, also known as Meteo data. This is where every accurate solar simulation begins. It includes critical parameters such as solar irradiation, ambient temperature, and wind speed, all of which directly influence system performance and long-term energy output. Without reliable Meteo data, even the most advanced PV system solar model cannot produce dependable results.
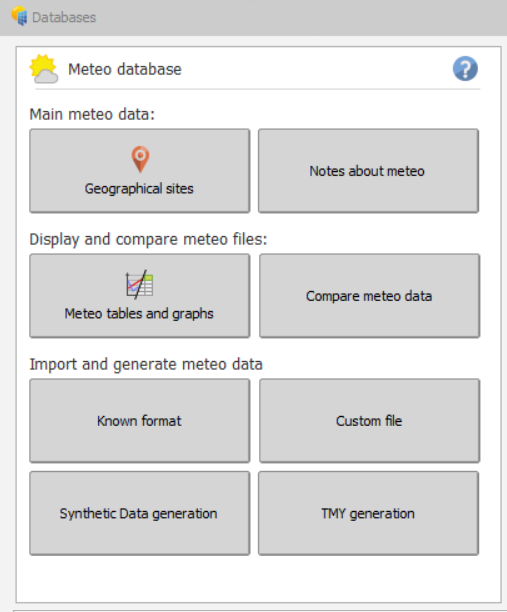
In PVsyst, the Meteo database (PVsyst > Databases) is structured to streamline climate data management. Secondly, PVsyst divides the Meteo database into three categories, allowing designers to efficiently select, import, and validate weather data for optimized PV system solar analysis and accurate project forecasting.
Meteorological data (also known as Meteo data) is what everything begins with in PV System Solar Design. Secondly, PVsyst divides theMeteo database (PVsyst > Databases) into three categories.
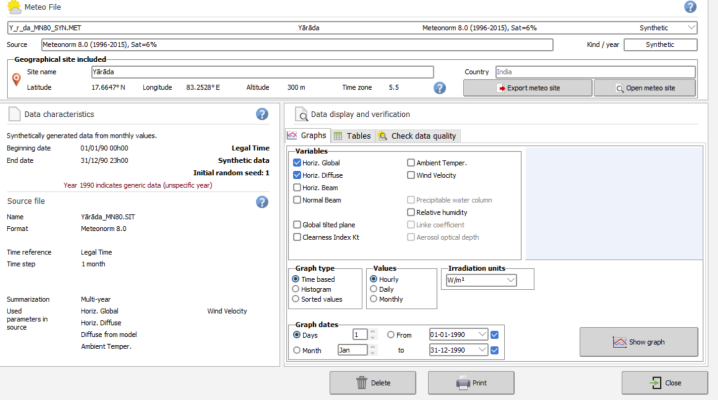
MainMeteo data: This contains the geographical data of a site. Also, this section provides the basic monthly meteo data for any location. Afterwards, we will store the data in the form of SIT files.
Display and compare meteo files: This section of PV System Solar Design displays the contents of the hourly data (.MET files). Additionally, we can analyse and compare hourly, daily and monthly values in the form of tables and graphs.
Import and generate meteo data: This section of PVsyst helps in importing meteo data from various external sources.
To understand how this data is used in system simulations and performance reports, read our detailed PVsyst simulation guide.
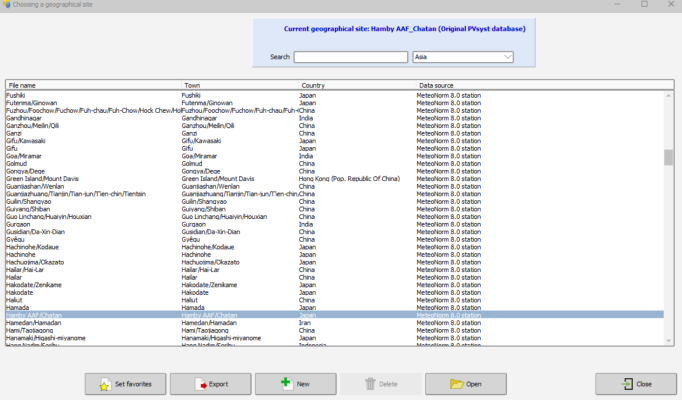
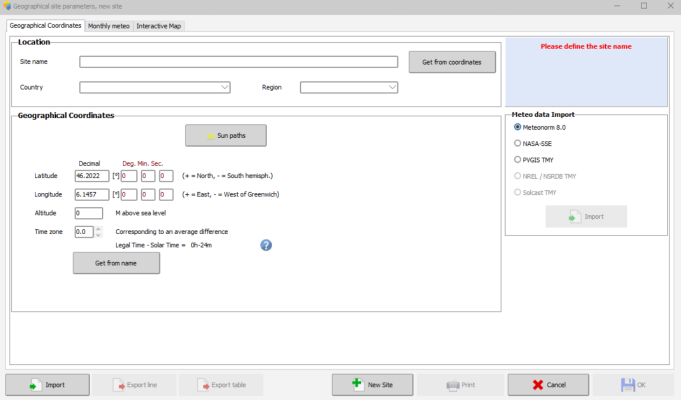
Geographical Sites
We begin the PV system solar design by entering the site’s geographical data for evaluation. PVsyst gives an option to choose the predefined site, or we can always create our own site by clicking on the new ” button.
Clicking on ” New ” opens a pop-up with three tabs, namely, Geographical coordinates, monthly meteo, and Interactive Maps.
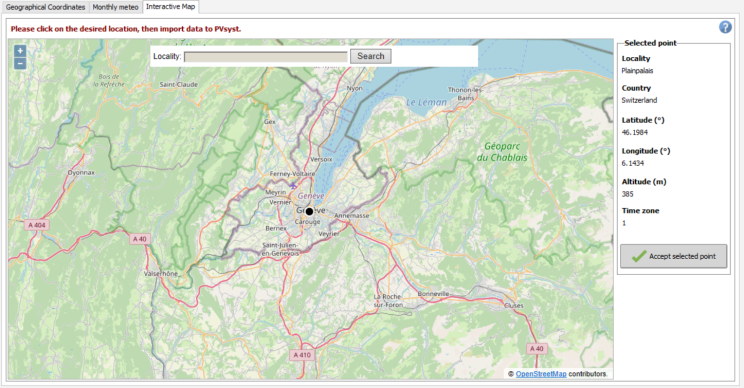
Interactive Map
The interactive map allows you to select the location manually on Google Maps. Further, we can select the desired location by giving the locality name and then zooming in and out of a particular point. Afterwards, clicking the “Accept selected point” option transfers the location to the geographical coordinates tab.
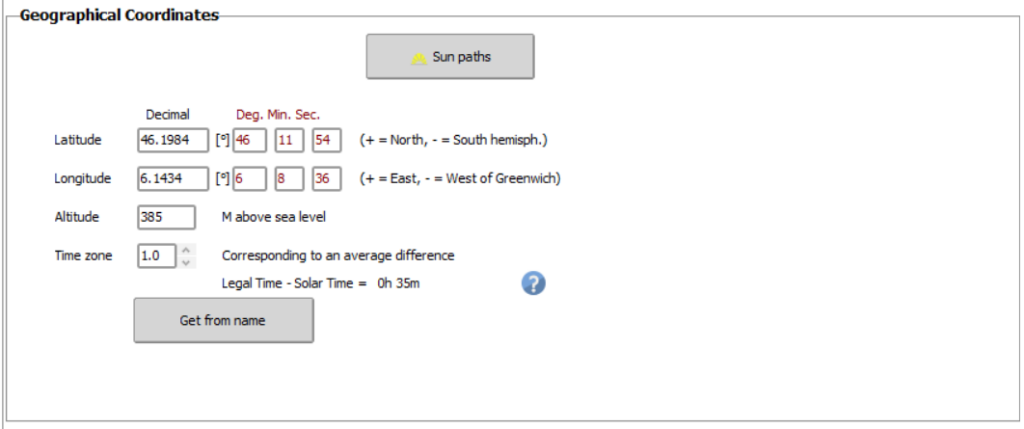
Geographical Coordinates
Selecting a location on the interactive map automatically transfers the location data to the geographical coordinates.
Or, we can always give the location manually with the basic details of location like latitude, longitude, altitude, and time zone.
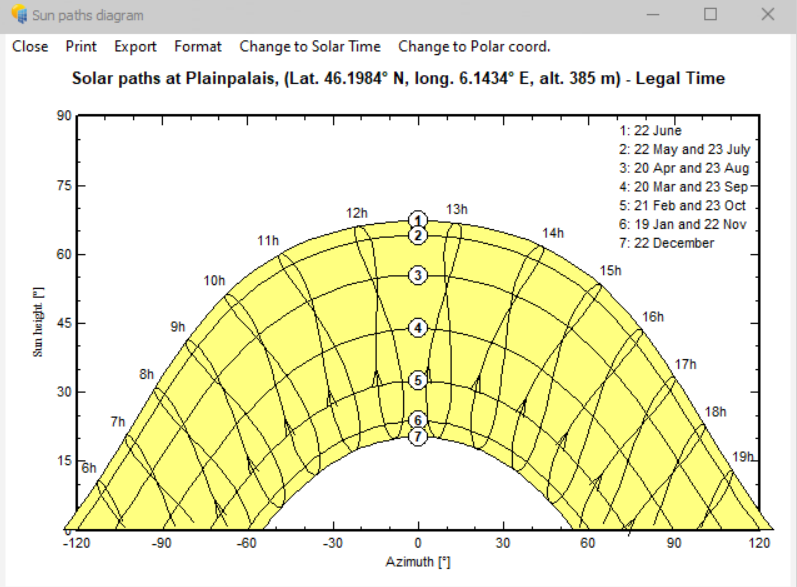
The sun paths button opens up a dialogue box, which gives the sun path diagram.Accordingly, the sun path diagram gives the information about sun orientation, i.e., sun height, along with the azimuth angle, corresponding to the location throughout the year.
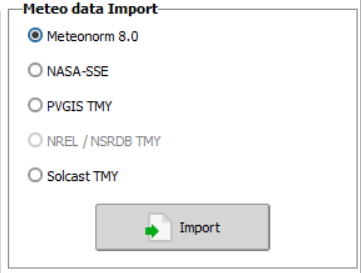
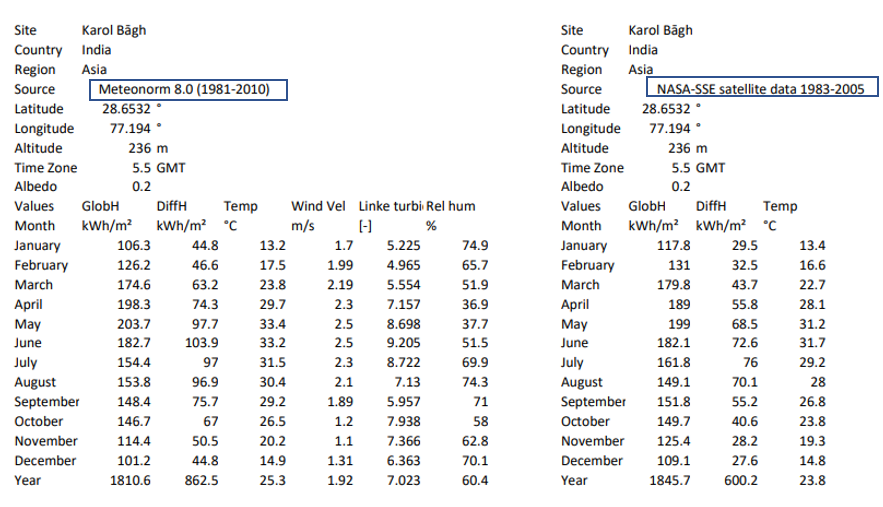
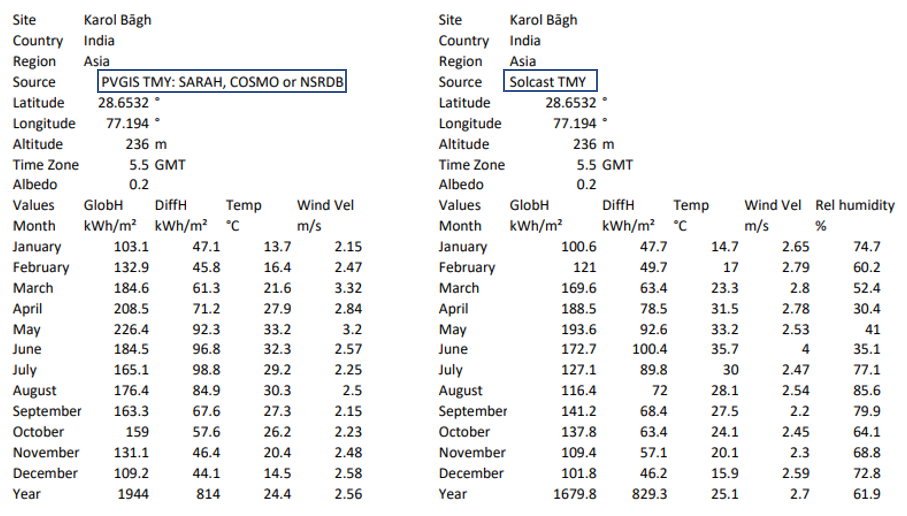
Then comes the next crucial step, importing meteo data. After defining a new site by geographical coordinates, PVsyst will import the meteo data from Meteonorm by default. Experts consider Meteonorm to be the most reliable source for monthly data. Also, there are other sources like NASA-SSE, PVGIS, and solcast from which we can get meteorological data.
Meteonorm and NASA-SSE are two monthly meteo data sources that are available online and offline. On the other hand, PVGIS and solcast are TMY (Typical Meteorological Years) data providers which require a working internet connection.
Now let’s look at each source individually.
◇ Meteonorm
It is the default meteo data source in PVsyst. This source provides the monthly meteorological data for any location, interpolated from more than 2500 stations all over the world. Additionally, it also generates synthetic hourly values from these monthly values.
◇ NASA-SSE
This source gives monthly data based on satellite measurements. The data provided is the average of 1983-2005 satellite measurements, provided for any cell in a grid of 1°x1° over the world.
◇ PVGIS
The Photovoltaic Geographical Information System gives monthly irradiance data. This information needs to be further transformed into hourly-based data for PVsyst. To explain, the GIS database covers two regions in different ways. Different ground meteorological stations supply the data for the European subcontinent, while satellite measurements averaged over 1985–2004 provide the data for the Mediterranean basin, Africa, and South-West Asia.
◇ Solcast
This source provides solar forecasting and historical data services. Additionally, it gives solar and weather data in three forms: time-series, TMY, and monthly averages.
Here’s a little comparison analysis of the above-mentioned data sources for the same place.
Let’s consider a place, say Delhi. It is located in the northern hemisphere, and is 1,978.51 mi (3,184.11 km) north of the equator.
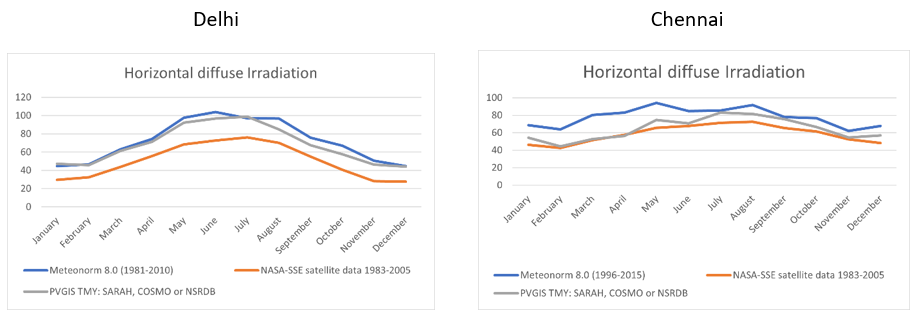
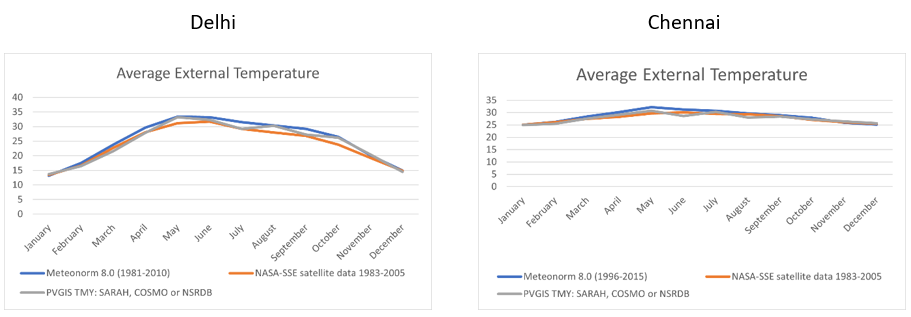
This is the meteo data from different sources for Delhi.
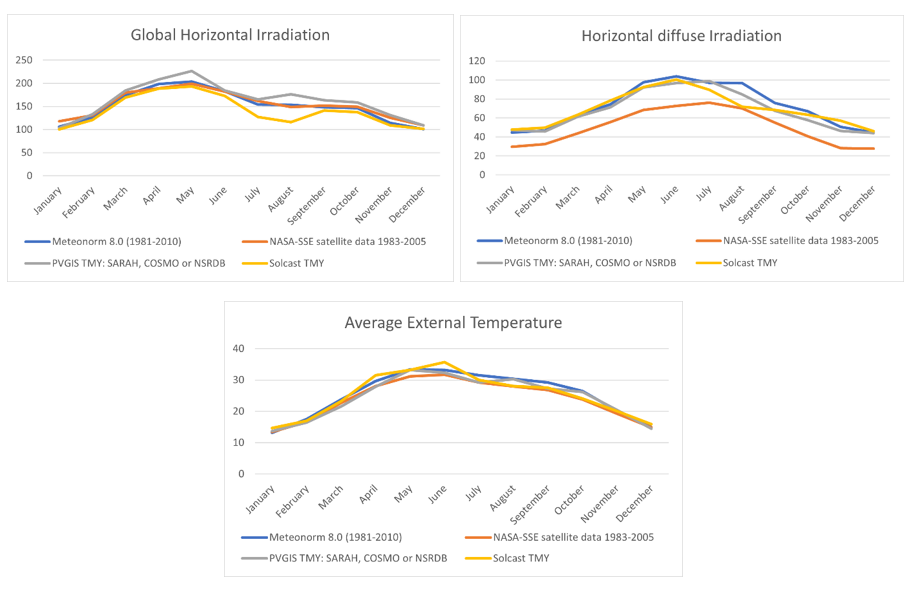
Let’s take a look at the above data with the help of graphs.
The global Horizontal Irradiation(GHI) data from PVGIS is slightly high, while the data fromMeteonorm and NASA-SSE are almost similar. On the other hand, the solcast TMY data between July and September hit a low, increasing the error gap when compared to other sources.
NASA-SSE reports comparatively lower horizontal diffuse irradiation values than the other three sources. And, the data for Temperature from the sources is quite consistent except for the solcast data between May and July.
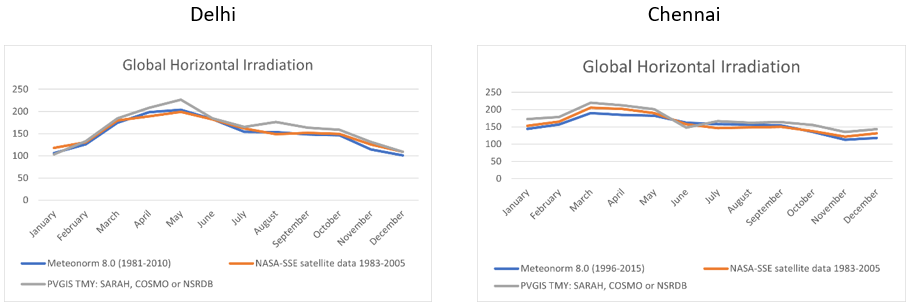
Let’s consider another place, Chennai. It is located about 900 miles north of the Equator.
PVGIS shows slightly higher Global Horizontal Irradiation values than the other two sources for both locations. The PVGIS data also shows sudden changes, while the other two sources exhibit more gradual changes.
When analysing horizontal irradiation data, PVGIS data show lower values than the other two sources for both regions.
We can observe that the data shows little variation in average temperature across the sources for both locations.
Above all, choosing a correct source is a decision, and it has to be made with careful attention. Any slight variation in this data can greatly affect the estimated energy generation.
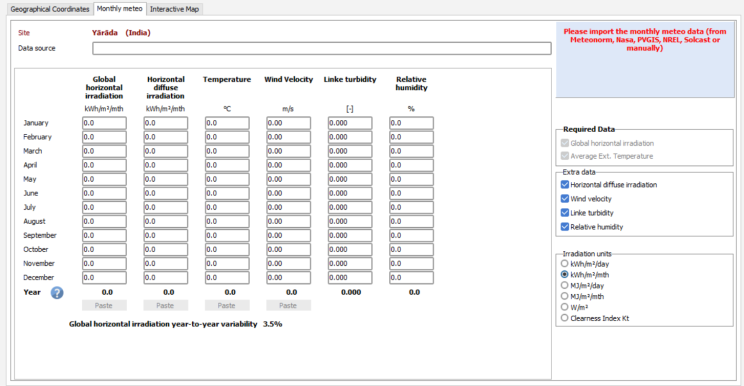
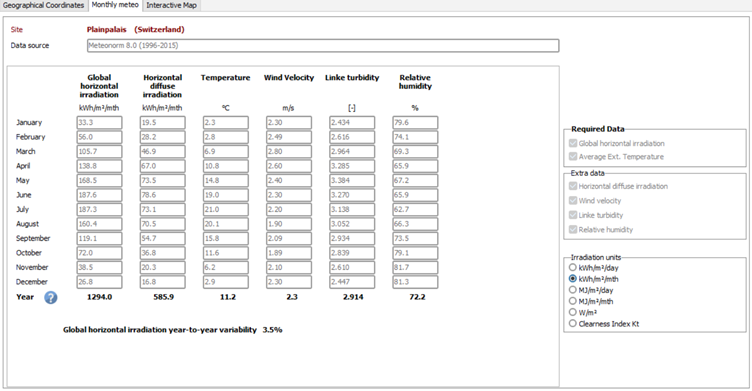
MONTHLY METEO
The meteorological data that is imported from the above-described sources consists of the following parameters divided into two categories:
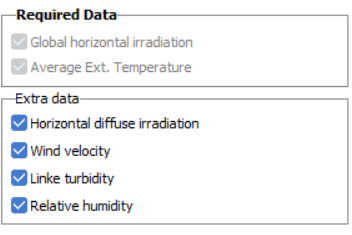
Required data:
Average External Temperature
Global horizontal irradiation
Extra data:
Horizontal diffuse irradiation
Wind velocity
Link turbidity
Relative humidity
The system requires mandatory input data, while users can add or remove the extra data parameters as per the need. Furthermore, the monthly meteo tab updates automatically as soon as users import the meteo data.
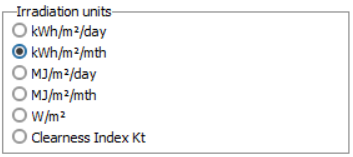
The default unit for the irradiation is kWh/m2/mth, while the same can be changed accordingly from the irradiation units corner.
All the units give data according to per square on a monthly or daily basis, while the clearness Index Kt is the ratio of the global irradiance to the corresponding extraterrestrial radiance.
The GHI year-to-year variability is very important for the probabilistic approach. It plays a key role in the calculations of P50-P90 values.
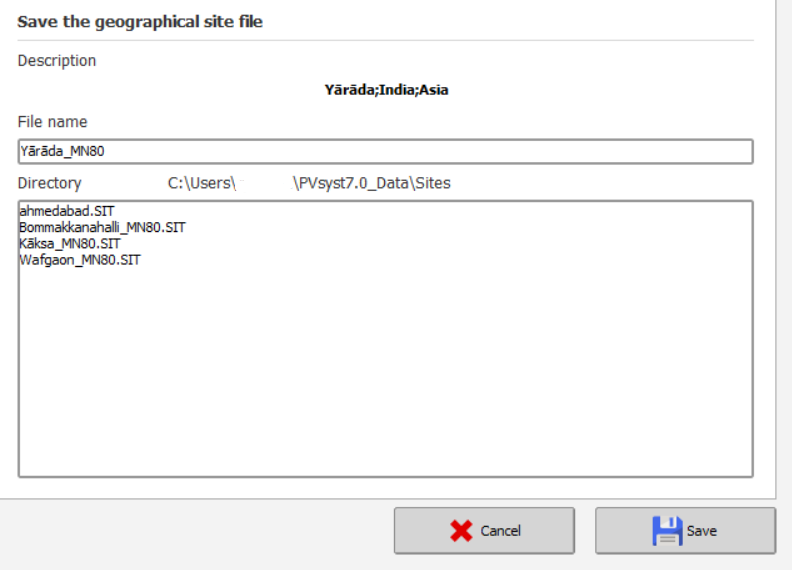
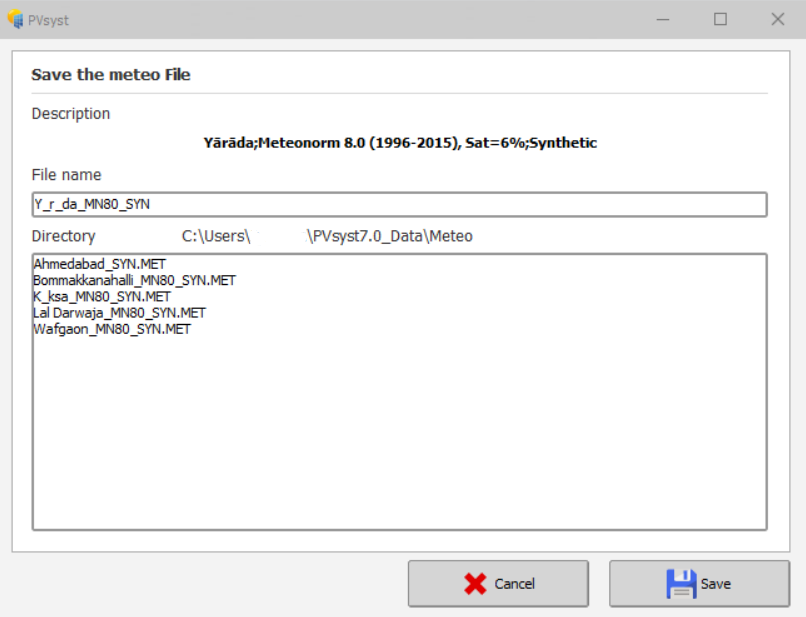
.SIT & .MET FILES
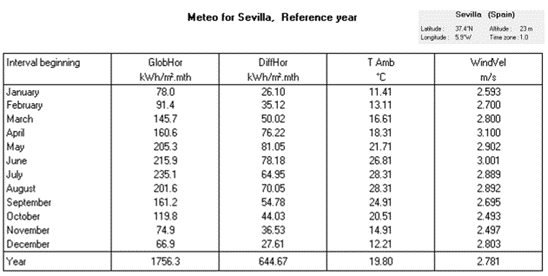
.SIT File: This file consists of Monthly meteo data.
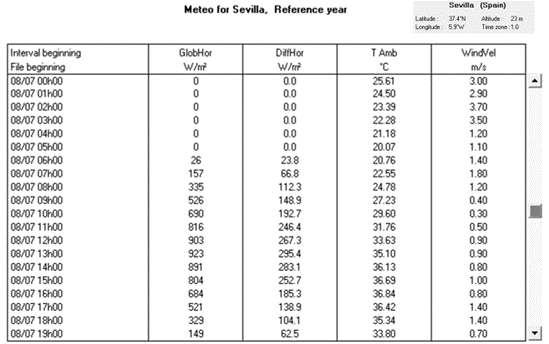
.MET File: This file consists of Hourly meteo data.
The .SIT and .MET files are generated back-to-back after importing the monthly meteo from the geographical site tab.
Contents of .SIT File
The .SIT file contains the geographical information of the site, like site name, country, continent, latitude, longitude, altitude, and Time zone. It also contains monthly meteo data, i.e., GHI & average ambient temperature, along with the optional data like Diffuse horizontal radiation, wind velocity, etc. (if included).
Contents of .MET file
The MET file contains the hourly values of the parameters generated from the monthly meteorological data from various sources. The latest versions of PVsyst automatically generate this file along with the .SIT file.
We can also generate it manually from the synthetic hourly data generation section.
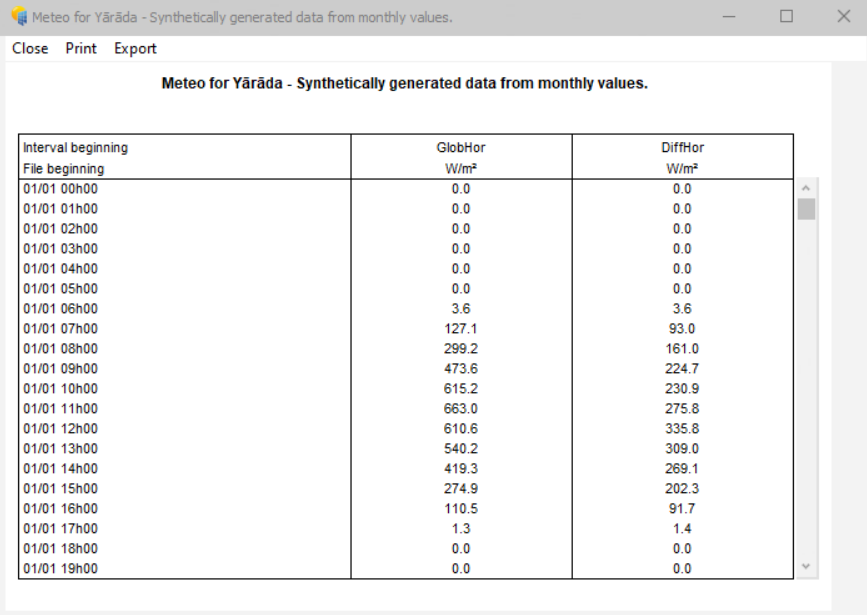
PV System Solar Design: METEO TABLES AND GRAPHS
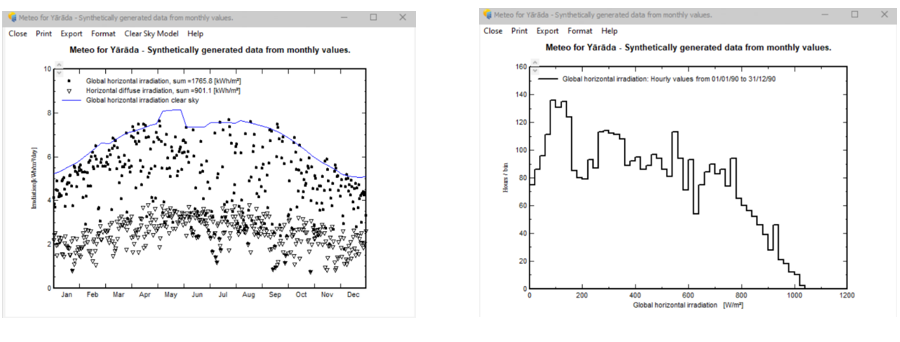
This section helps in comparing and analysing the Hourly, daily, and monthly values of various variables using different types of graphs. So, there are three types of graphs available in PV System Solar Design: time-based, Histogram, and sorted values.
We can analyse the values in a table format too.
To understand, study the examples below:
The first graph is a time-based plot of monthly meteo data, while the second is a histogram of those monthly values.
Below is the table which shows hourly values of the meteo data.
IMPORTING DATA FROM EXTERNAL SOURCES
Importing data from external sources into PVsyst poses a high-risk factor. One must perform this task with utmost care and great precision, as the data represents the main source of uncertainty in the simulation. Therefore, the experts strongly recommend using data from reliable sources. A cross-check of data is a must before proceeding any further with the evaluation.
Experts do not recommend using self-measured data unless they obtain the measurements using highly calibrated equipment and proper guidance from qualified specialists.
CONCLUSION
The evaluation of any project starts with the management and organisation of PVsyst meteo data. So, engineers must handle this with extreme care, as any variation in meteorological data can hamper energy generation results. In the next part of this guide, we will move beyond meteo data to explore how PVsyst models losses and other critical factors that impact PV system performance. Watch this space as we break down loss factors and learn how to refine your simulations for even more accurate energy yield predictions. — Connect with us on LinkedIn to stay updated on our latest articles and industry news. Click here to read our latest posts.click here to read our latest posts.